Working Group 4 of the Portuguese Commission of Tunnels and Underground Space decided to present the webinar “BIM for GeoSciences” organized by Geovita AS (Geotechnical and Rock Mechanics engineering consultants in Norway) and NGI (Geotechnical Institute of Norway). This webinar is about BIM modeling of underground structures and ground conditions and is divided into several parts.
The first part covers stratigraphy modelling and the power of parametric modelling for sheet piles.
Synopsis Part 1 PT (8 min reading)
Webinar Part 1 EN (57:42): https://www.youtube.com/watch?v=pmu5iUVCdnE
#webinar #bim #geology #parametricmodelling #sheetpiles
Introduction to context and tools:
If we focus on infrastructure projects and geotechnical engineering, the underground in urban areas is increasingly congested, which translates into increased complexity for new developments. Projects are also getting bigger and more agile as design and construction are carried out in parallel. With digitization, cloud storage and smart sensors (IoT) we are able to collect more data. From this data we need to be able to gain greater understanding, to increase our knowledge base, using for example machine learning. Finally, geotechnical engineers must prepare for designs without drawings, which will be arriving soon, and adopt a model-oriented work process.
In this context, Geovita and NGI felt the need to revitalize the way they work to design smarter and manage data in a more structured way. They also felt the need to encourage an improvement in standardization in their specialties.
Modelling of soil layers
The modelling made for a specific project in Norway with 540 m of cut-and-cover and 270 m of tunnel is presented. The software used was Leapfrog works. The software allows the import of boreholes from Excel files. In the case presented, there was information from 101 boreholes. In addition to the geological boundaries, the surfaces of the natural ground, rock mass and water table were also modelled based on the interpolation of known points.
The software also allows the import of the design structures, enabling their representation in transversal sections and longitudinal profiles. Based on this information, it is possible to identify the calculation sections and export them directly to Plaxis or Slope. In case there is a need to introduce new boreholes, or to correct some information already loaded in the model, it is automatically updated, as well as the sections. It is necessary to export the sections again to the calculation software, but this interoperability makes the whole process much easier.
Uncertainty is represented visually on the basis of transparencies. istances are defined around the boreholes, forming more vividly coloured capsules.
Although the example presented is from a large project, the presenter believes, based on his experience, that small projects also benefit from three-dimensional modelling.
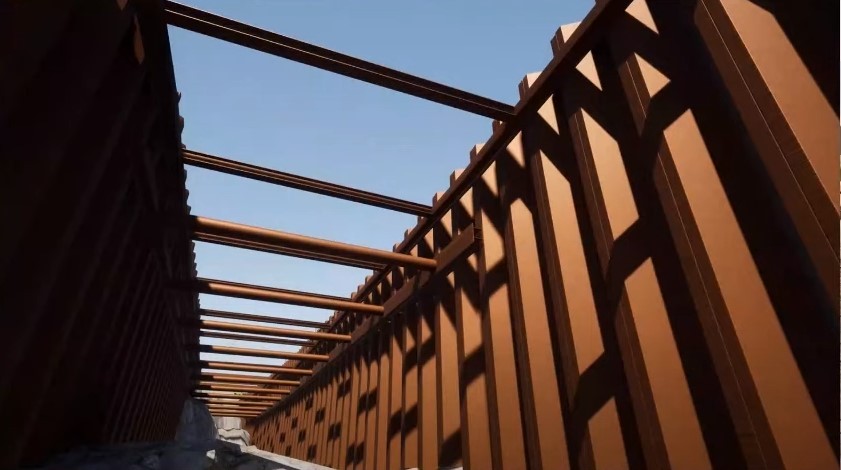
Parametric modelling of sheet piles
The used softwares were Rhino, Grasshopper and Tekla. The ground and rock mass surfaces were imported from DWG files. The scripts were developed in-house. One of the scripts is to make the transformation between local and global coordinates, since in Rhino and in Tekla global and local coordinates are used, respectively. The script that generates the walls (in Rhino and Tekla simultaneously) allows you to choose the profile of the piles, based on the Tekla library, define the maximum depth and invert the position of the profiles. After the two sheet pile walls are in place, there are two other scripts, one for placing struts and one for placing anchors.
Since all modelling is parametric, any change request is easily accommodated. When increasing, for example, the spacing between the walls, the length of the struts is automatically adjusted.
Design-specific information is also loaded into Tekla via Grasshopper. An IFC was exported from Tekla where the quality of the model in terms of geometry and information can be checked. It is also mentioned that this IFC can be the basis for communication between team members.
Communicate uncertainties in the rock mass model
Rock mass modelling is often obtained from the triangulation between boreholes. This surface has, therefore, an associated uncertainty, which is analysed in two ways: the length of the sides of the triangles and the distance to the boreholes. Both analyses were done on Rhino. In the first analysis, a traffic light colour scale is defined and applied to the ground surface, which is later exported to a GIS platform, where it can be viewed together with other GIS information.
At the end of the webinar, the link between Rhino and Twinmotion was mentioned, which allows rendering the project and producing photo-realistic images and videos with some ease.
BIM for Geosciences Webinar Part 2 to Part 4
The CPT GT4 will soon present synopses for the remaining editions of this webinar. These editions can be viewed via the following links:
Webinar Part 2 EN (54:53): https://www.youtube.com/watch?v=Xvwg4_F6azY
Webinar Part 3 EN (48:37): https://www.youtube.com/watch?v=5frwiM9Gd4s
Webinar Part 4 EN (55:01): https://www.youtube.com/watch?v=k_WdtkEWuFk